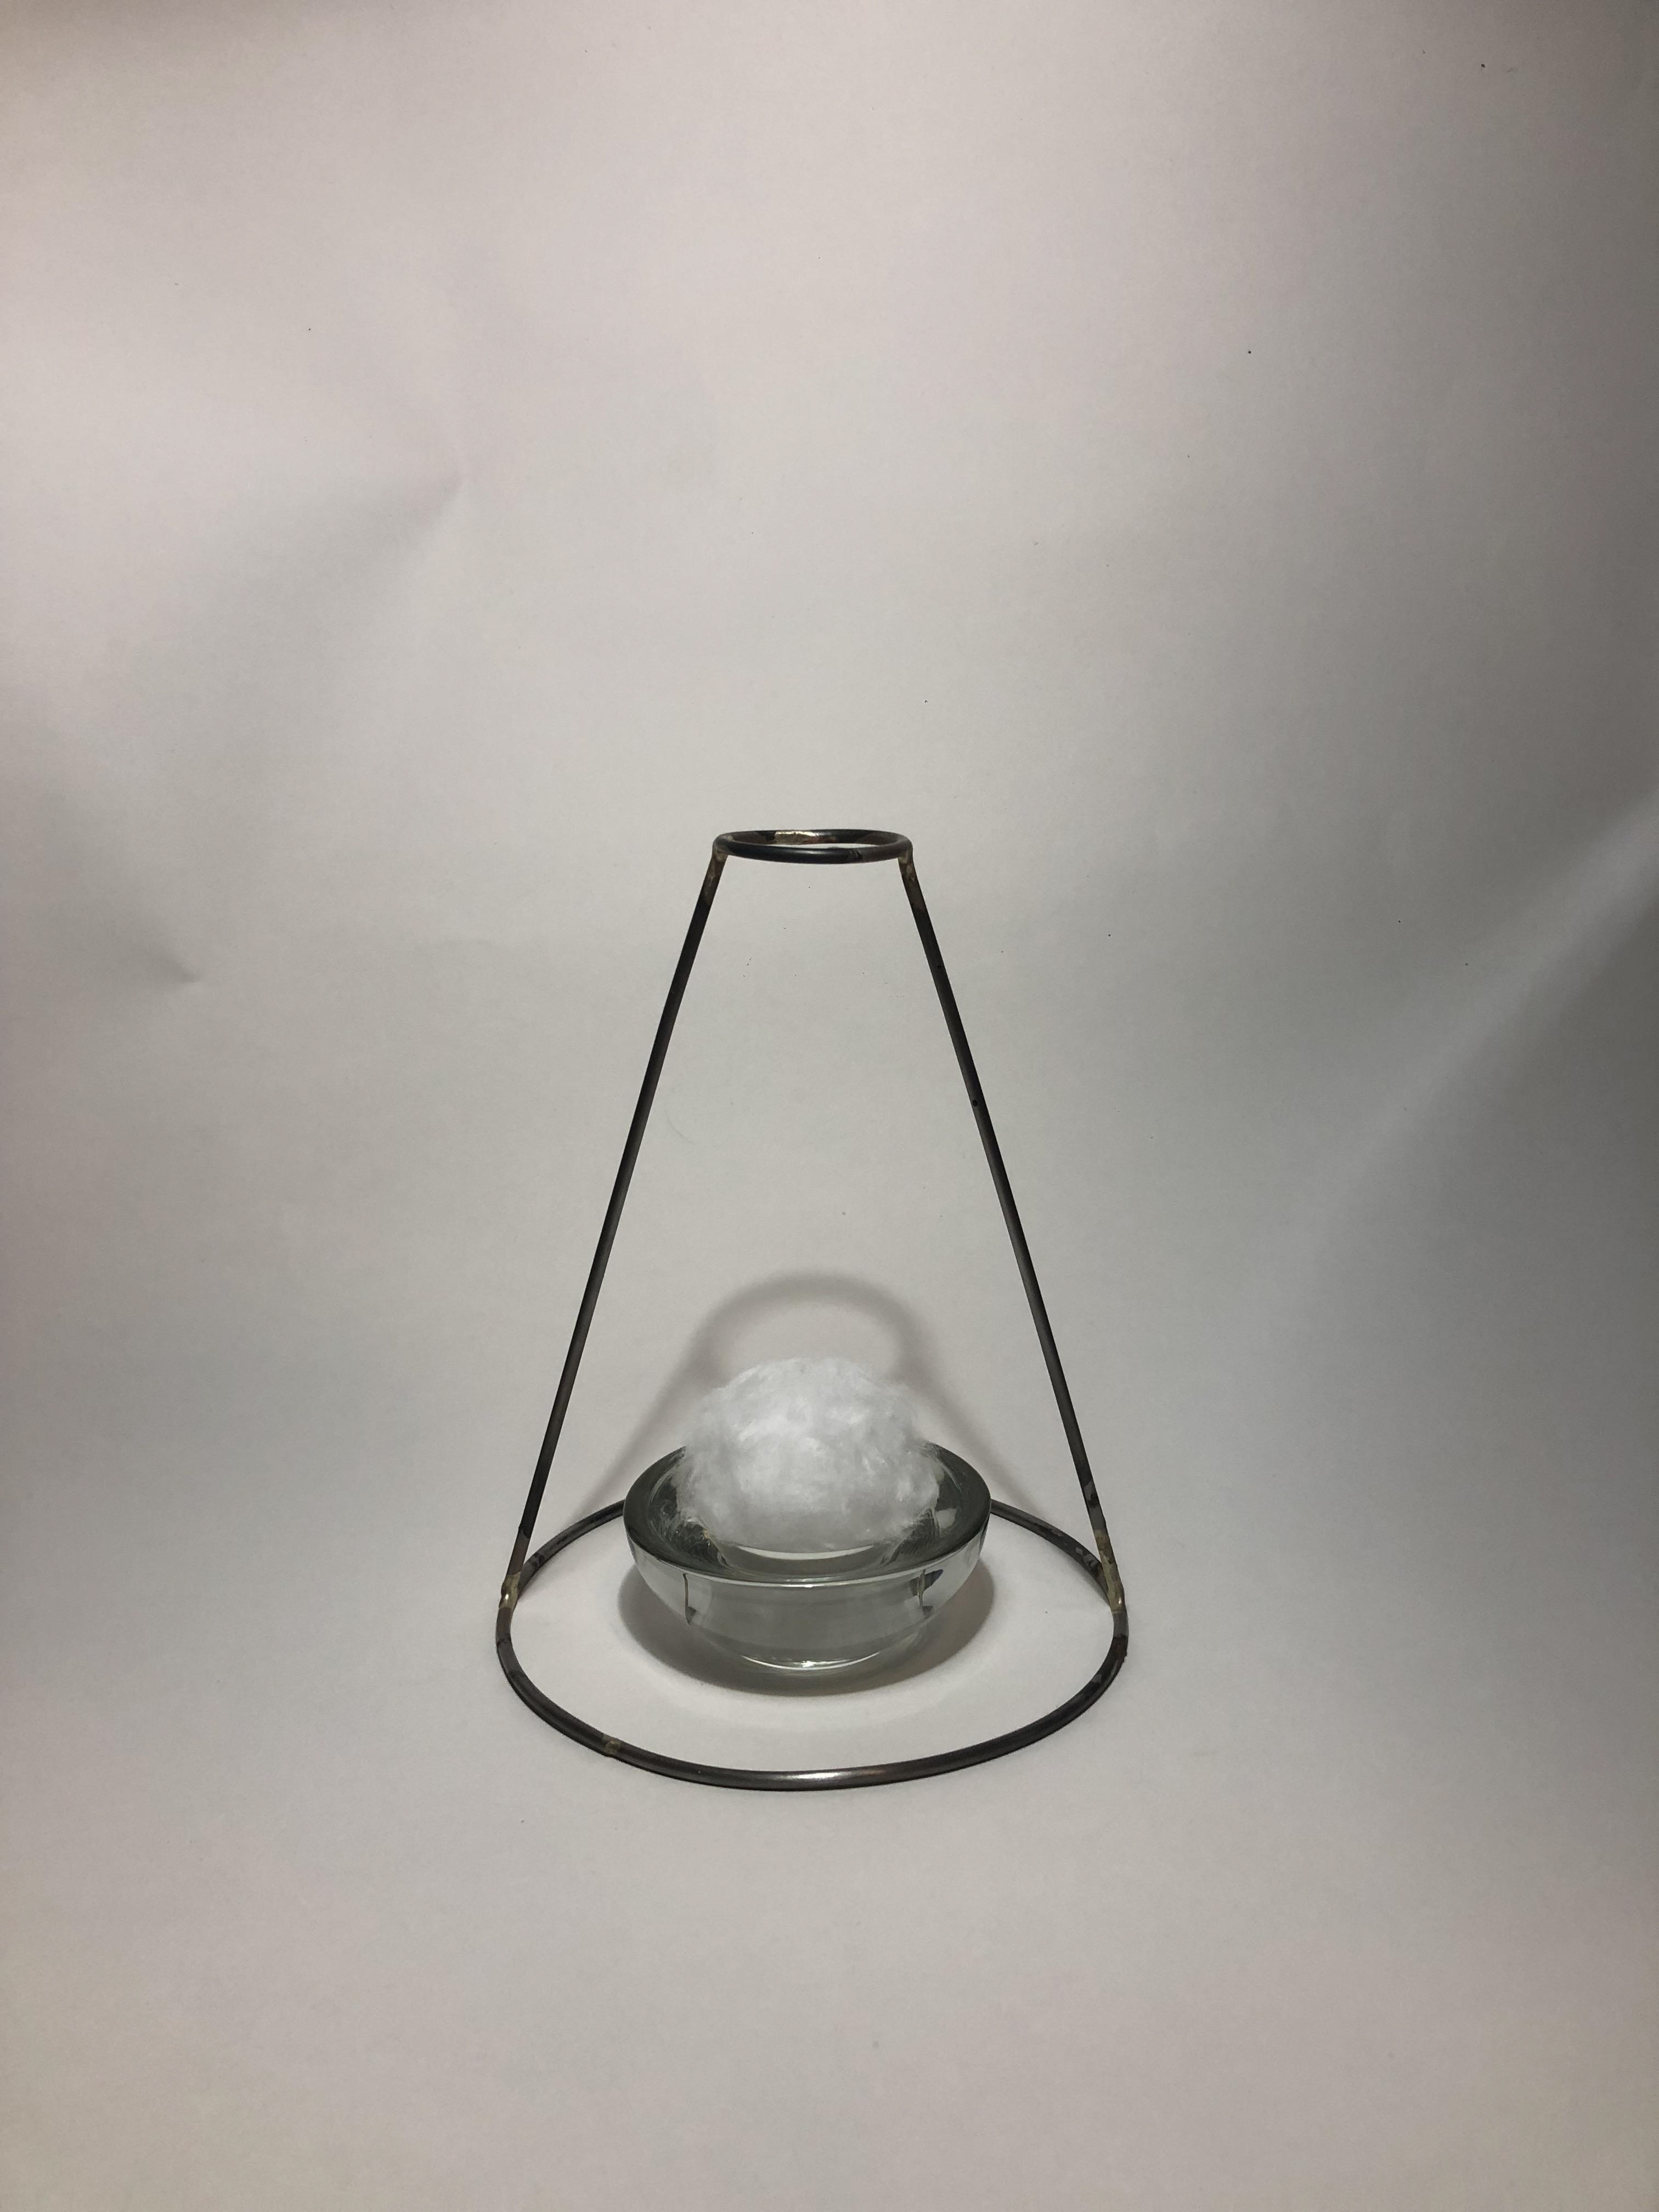
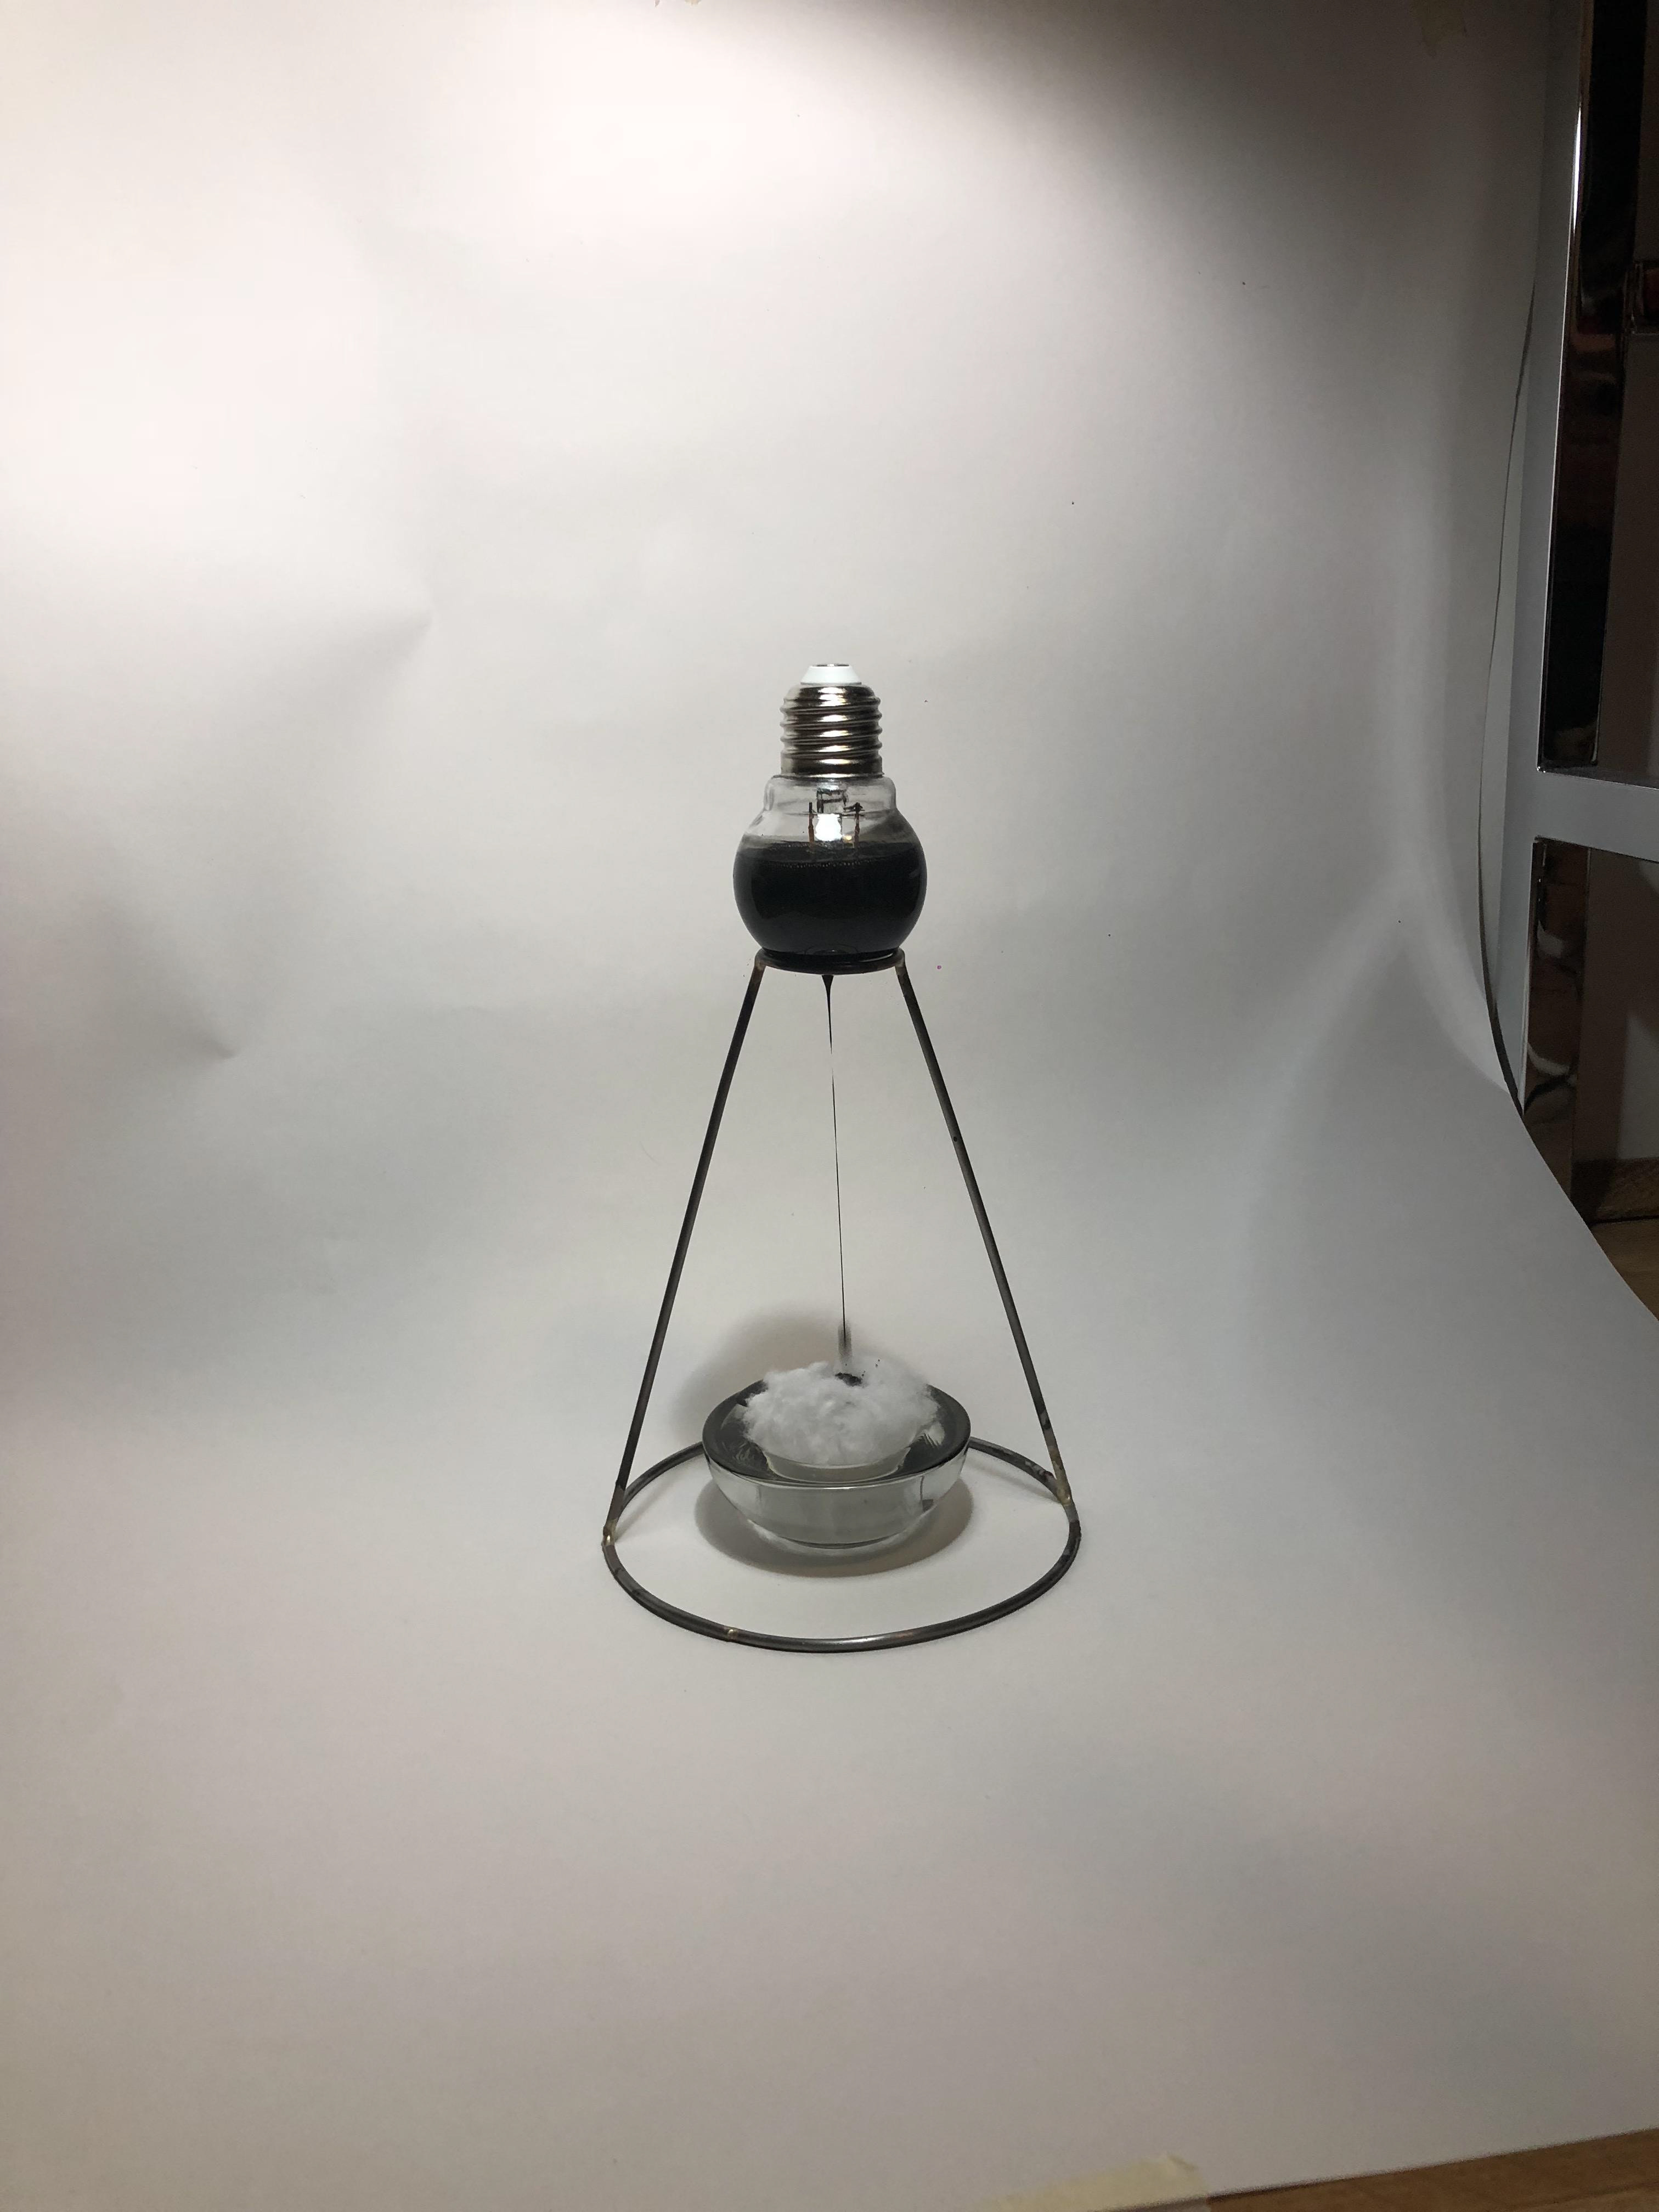
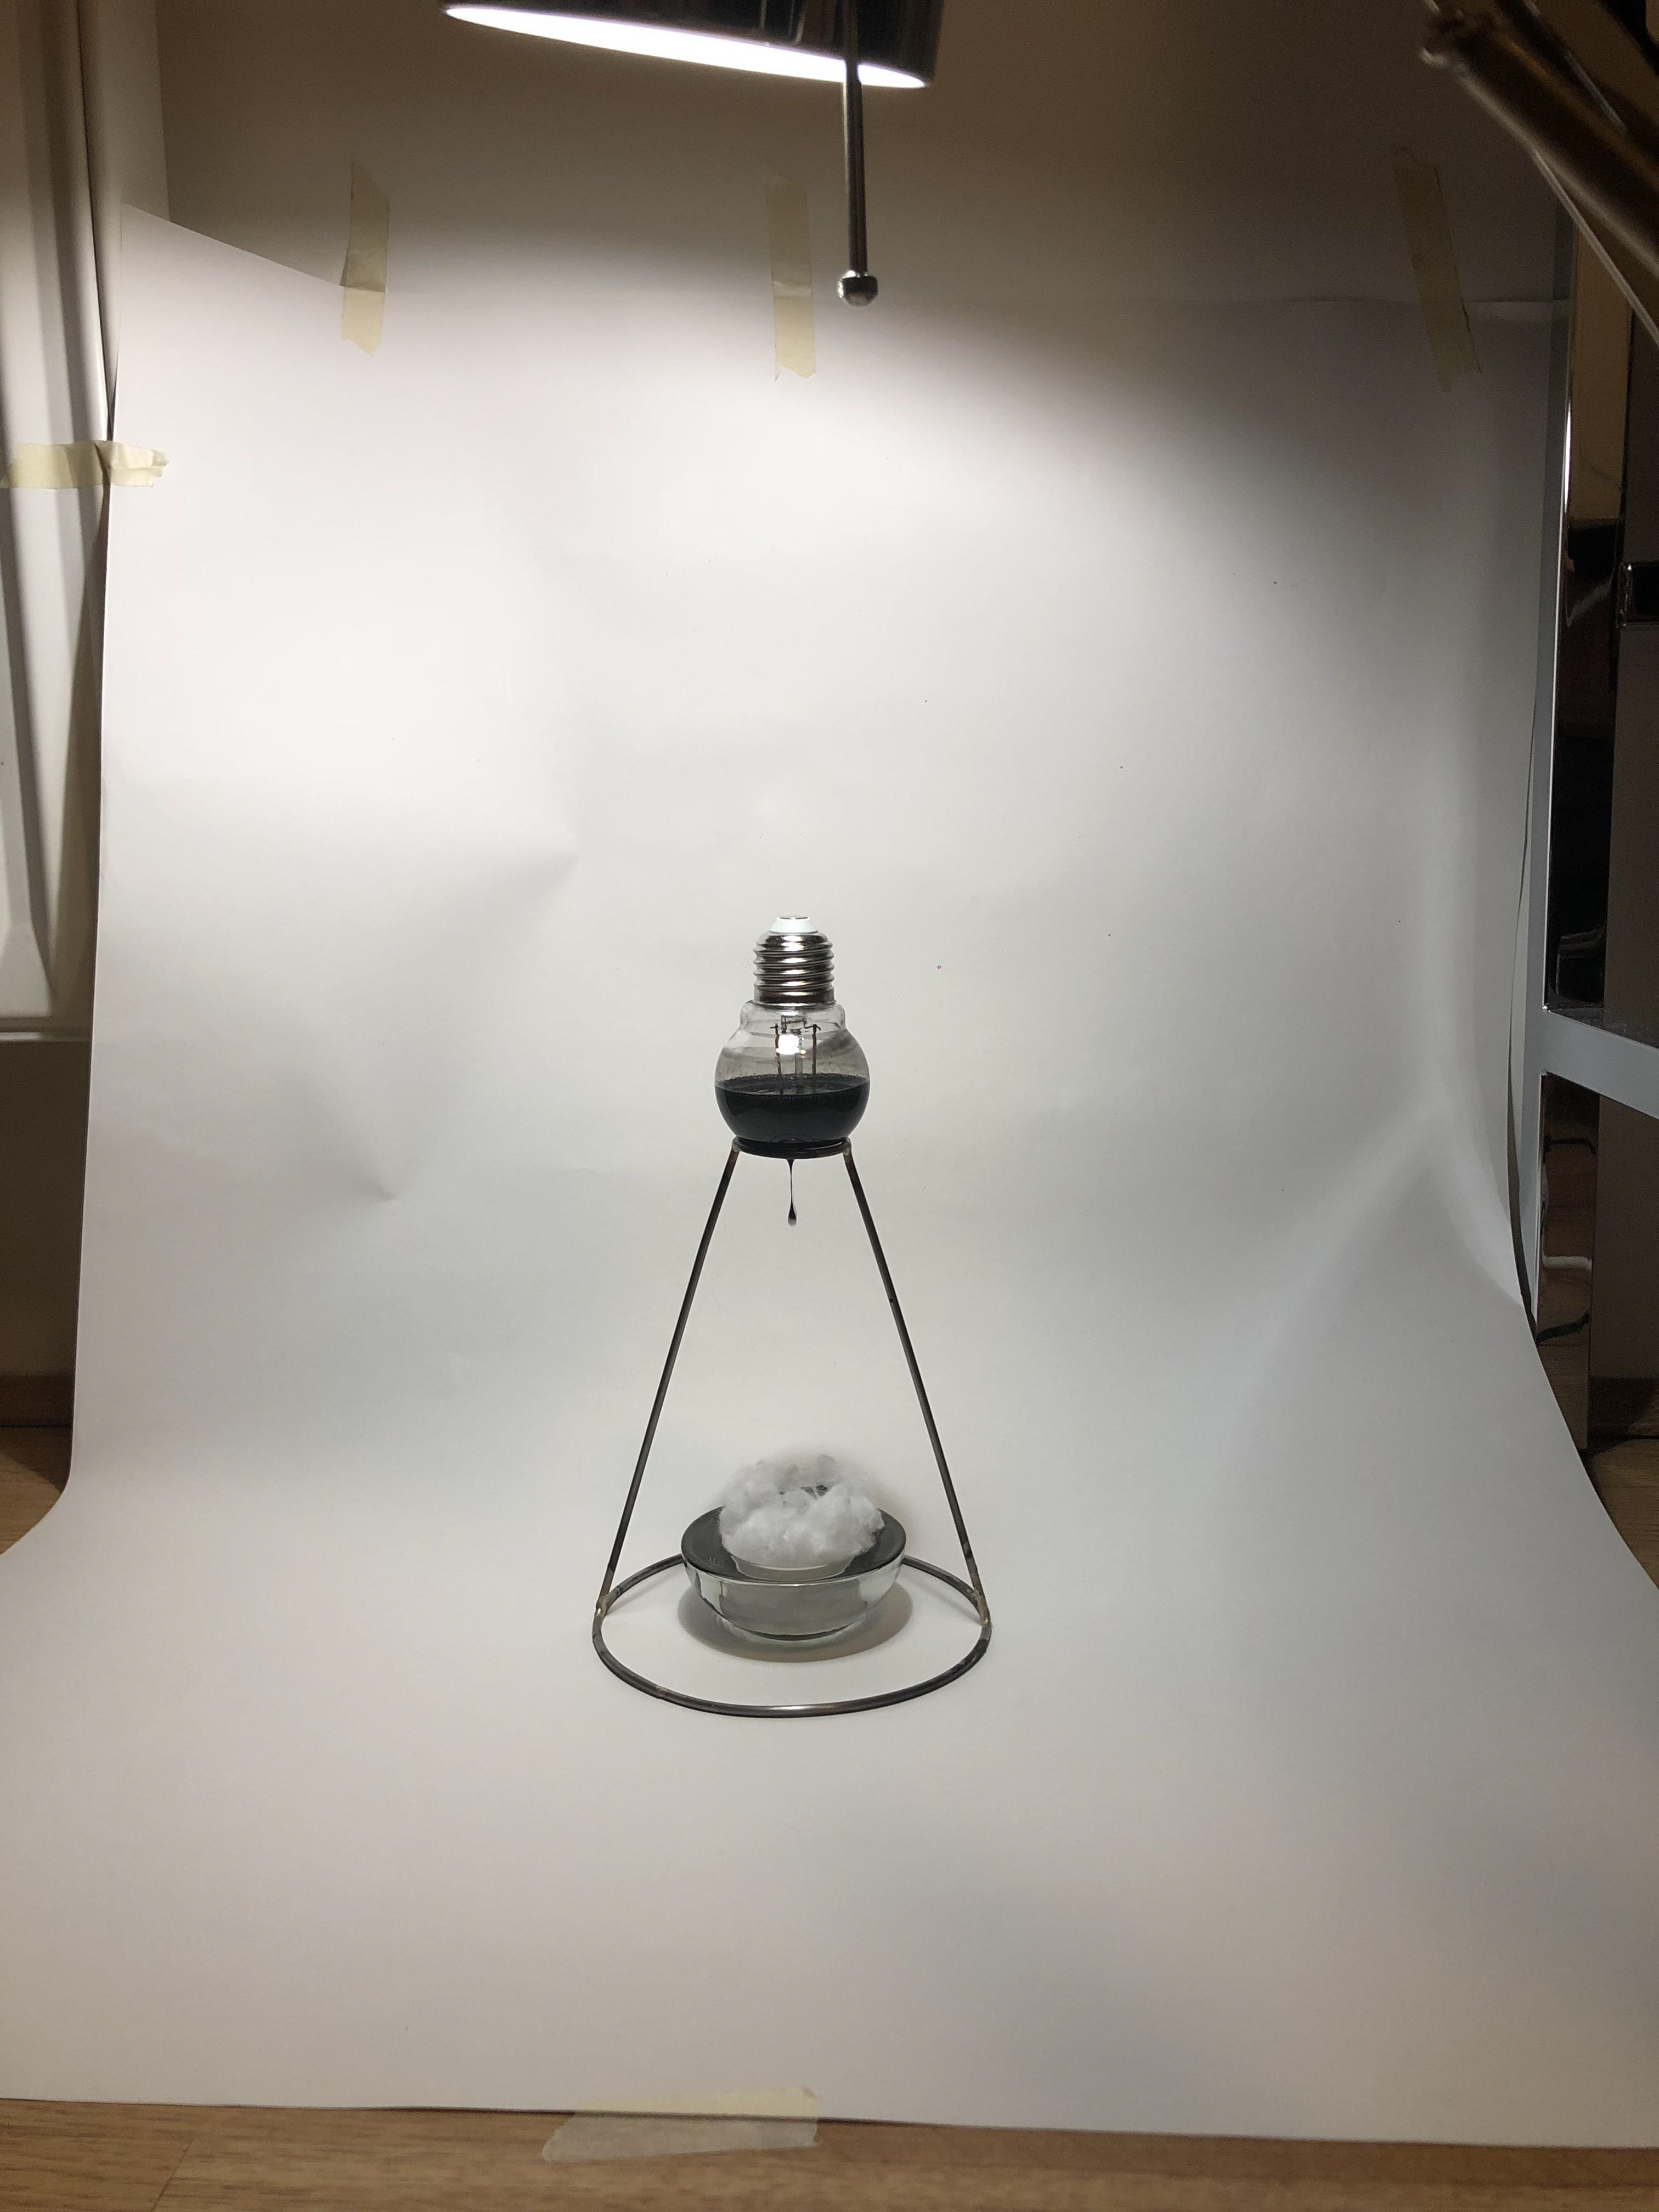
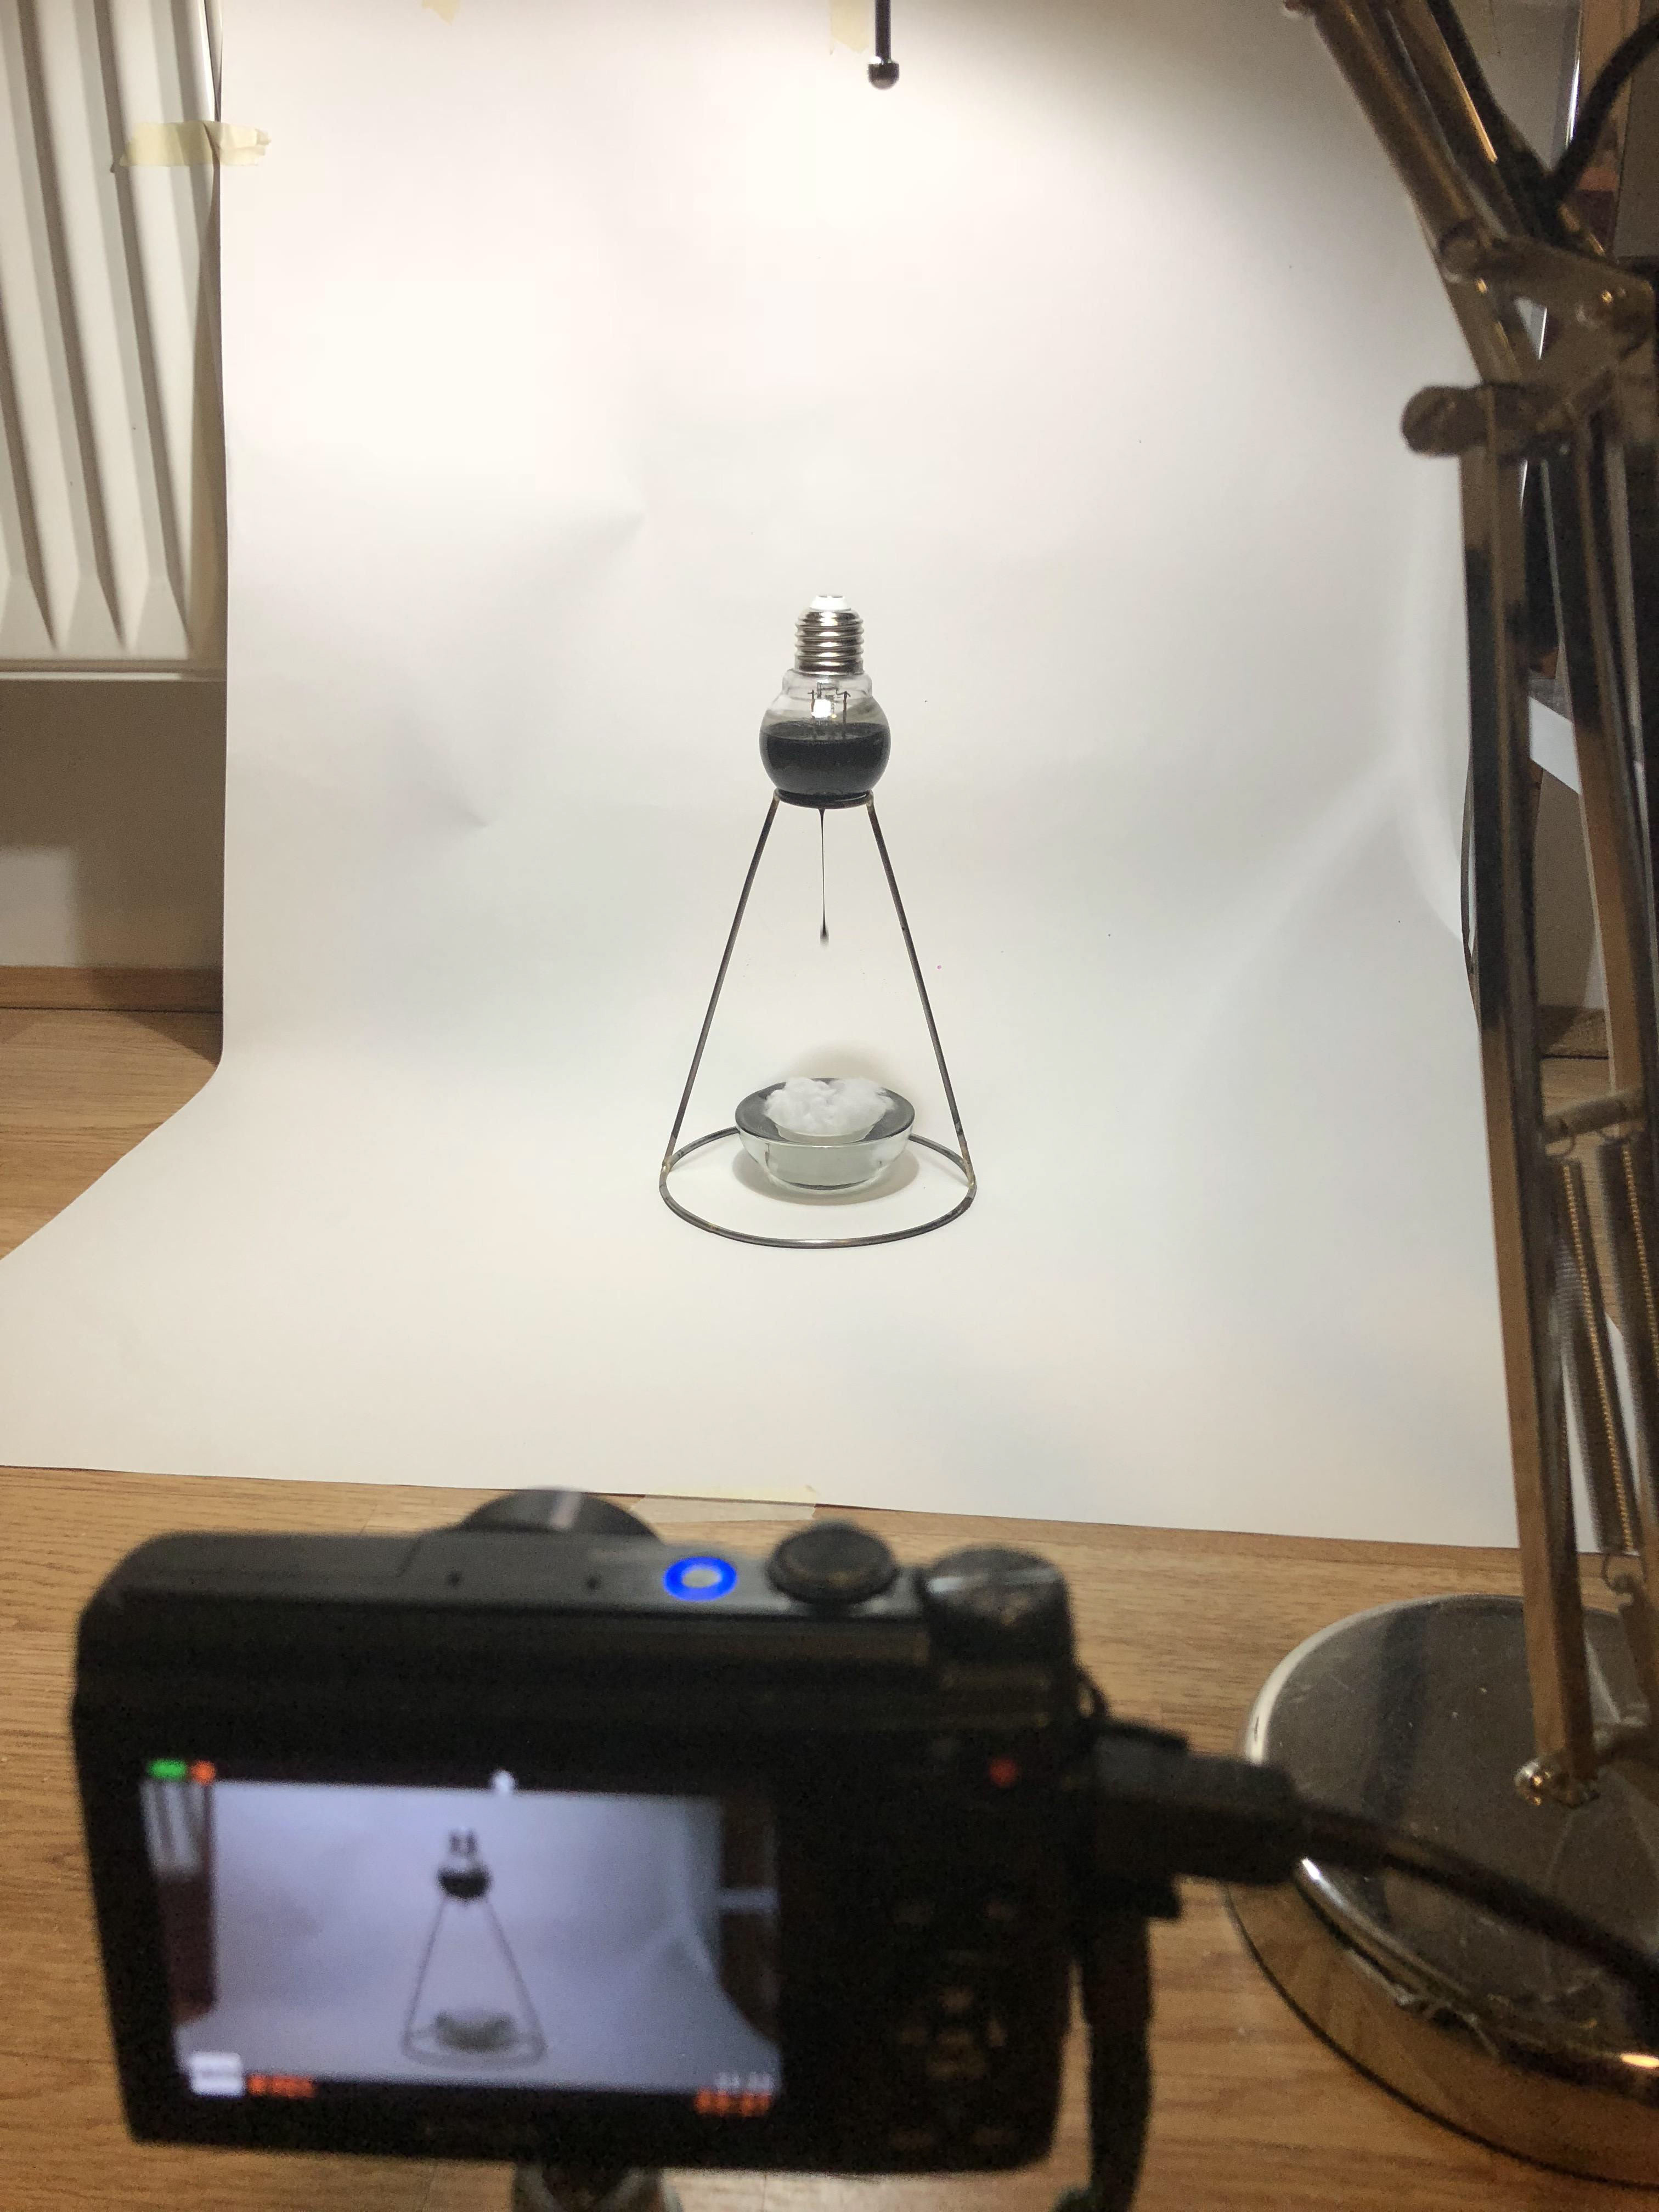
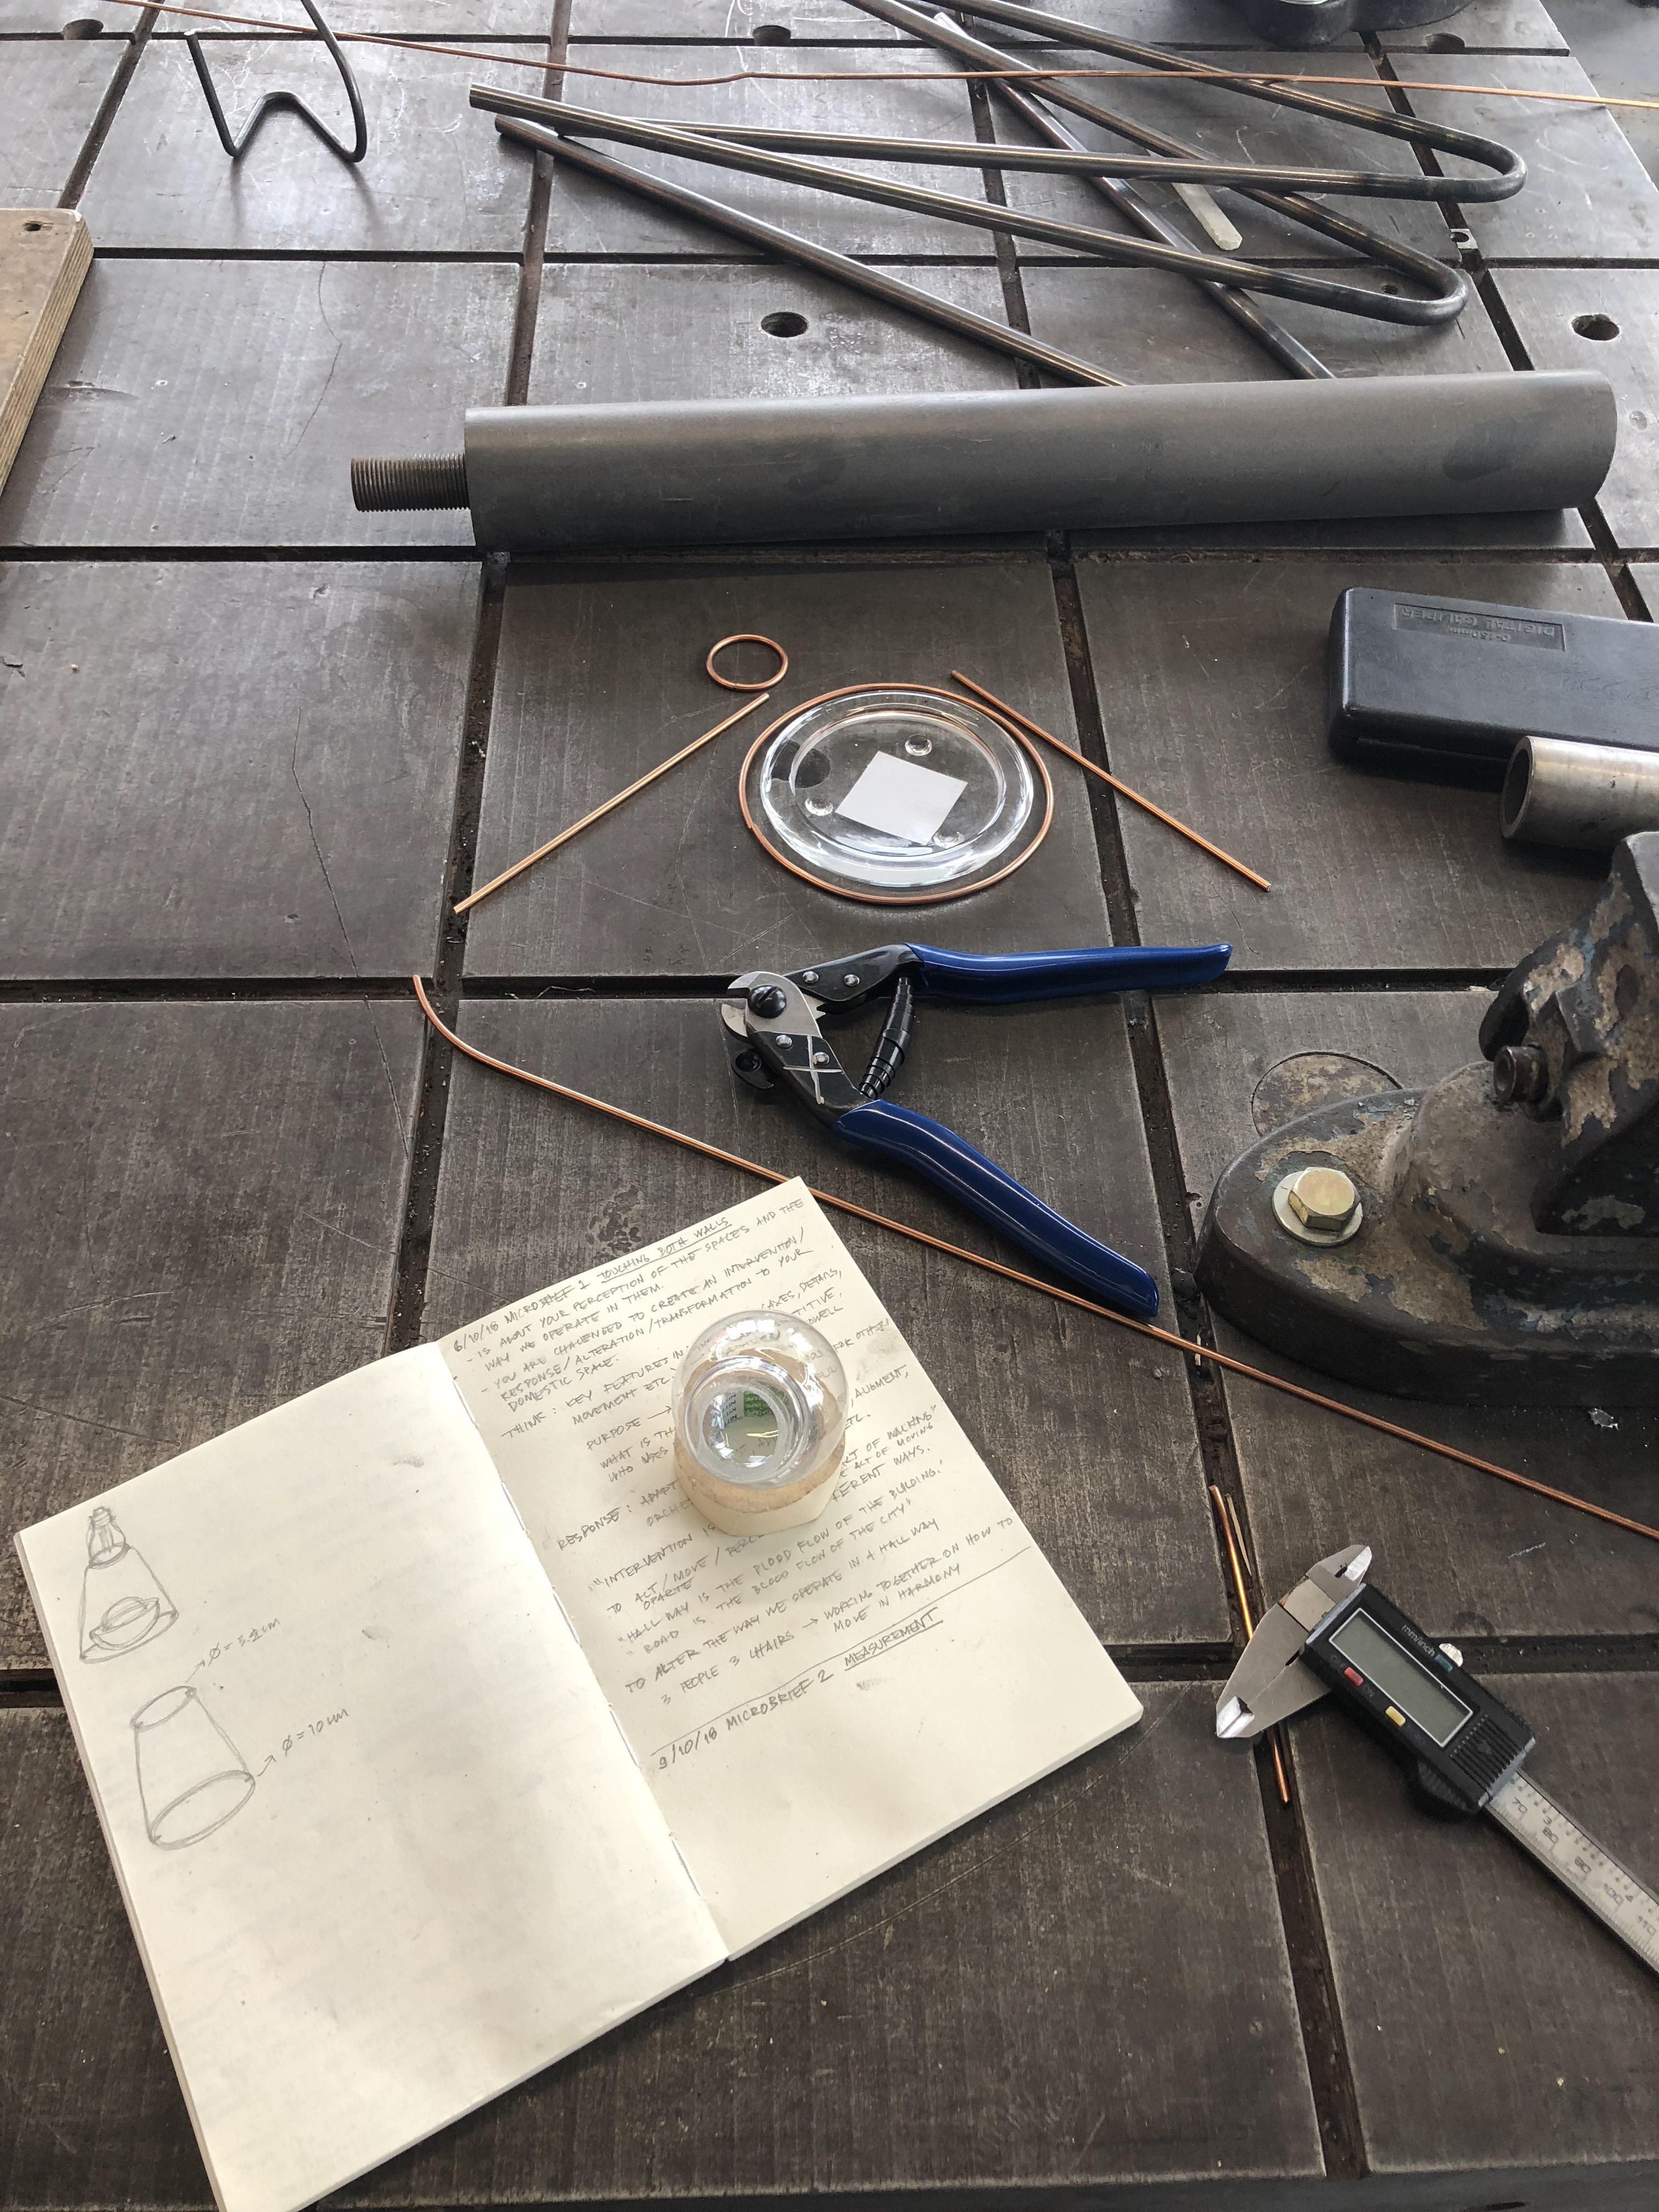
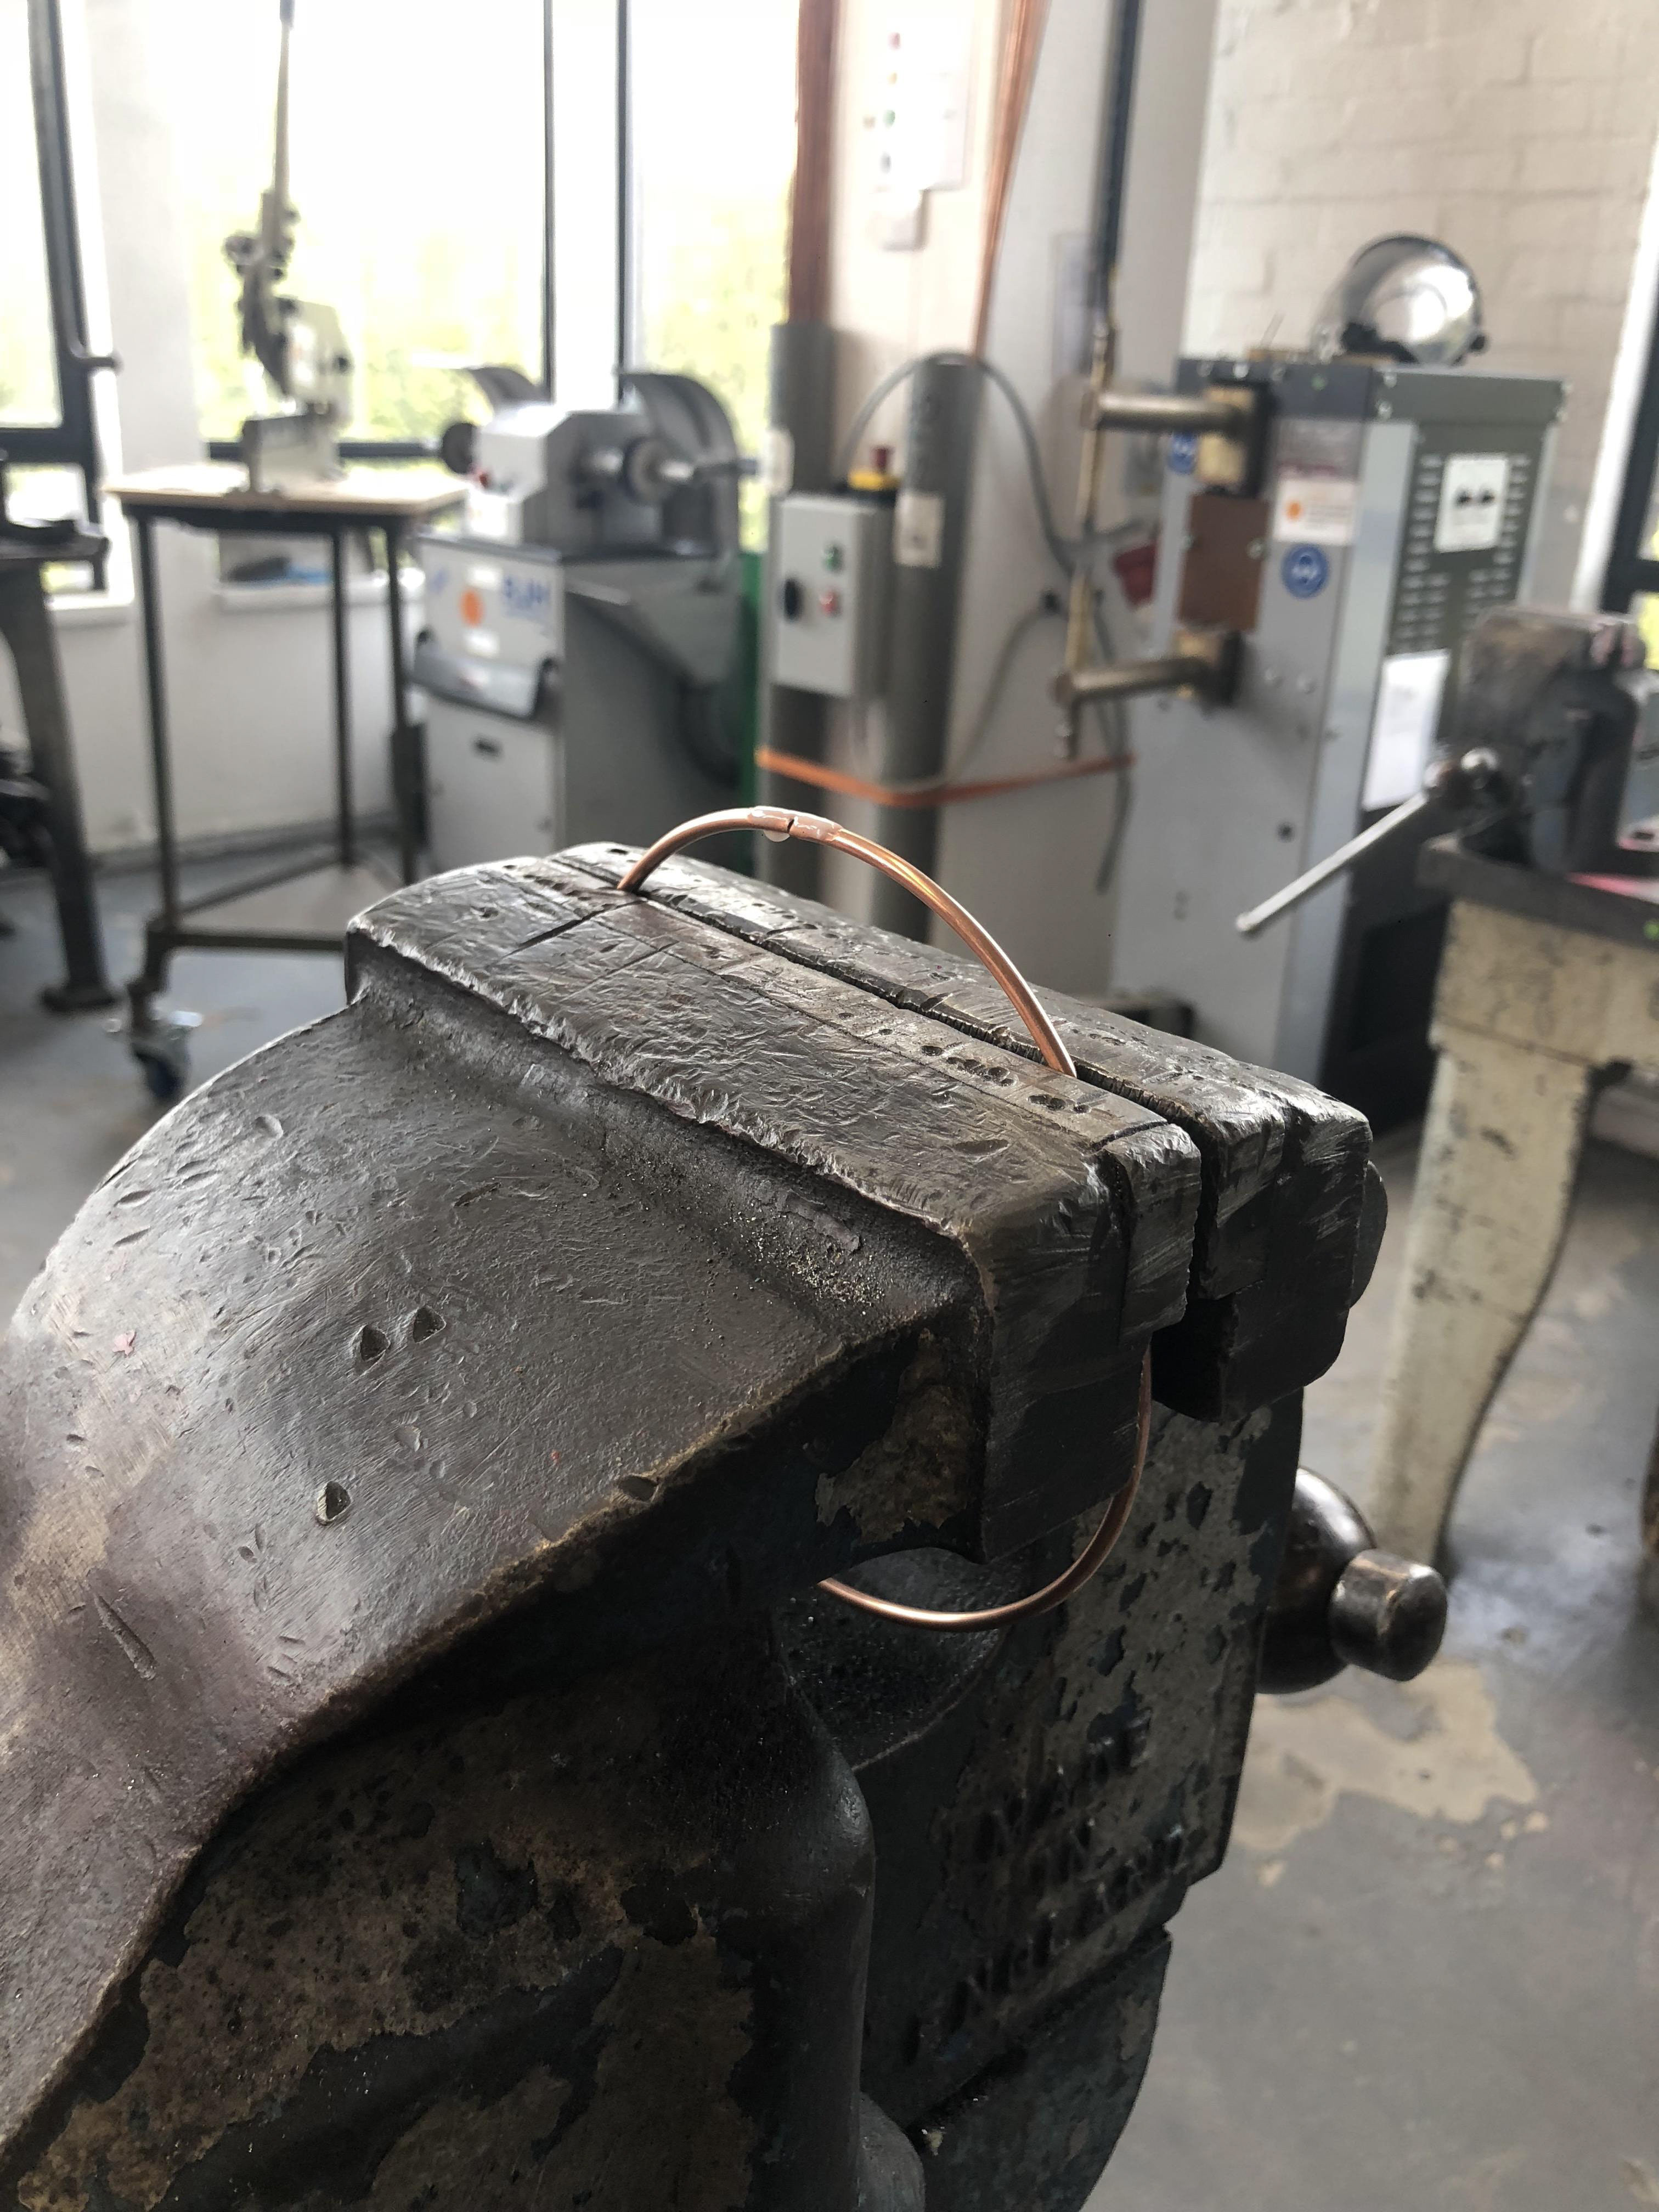
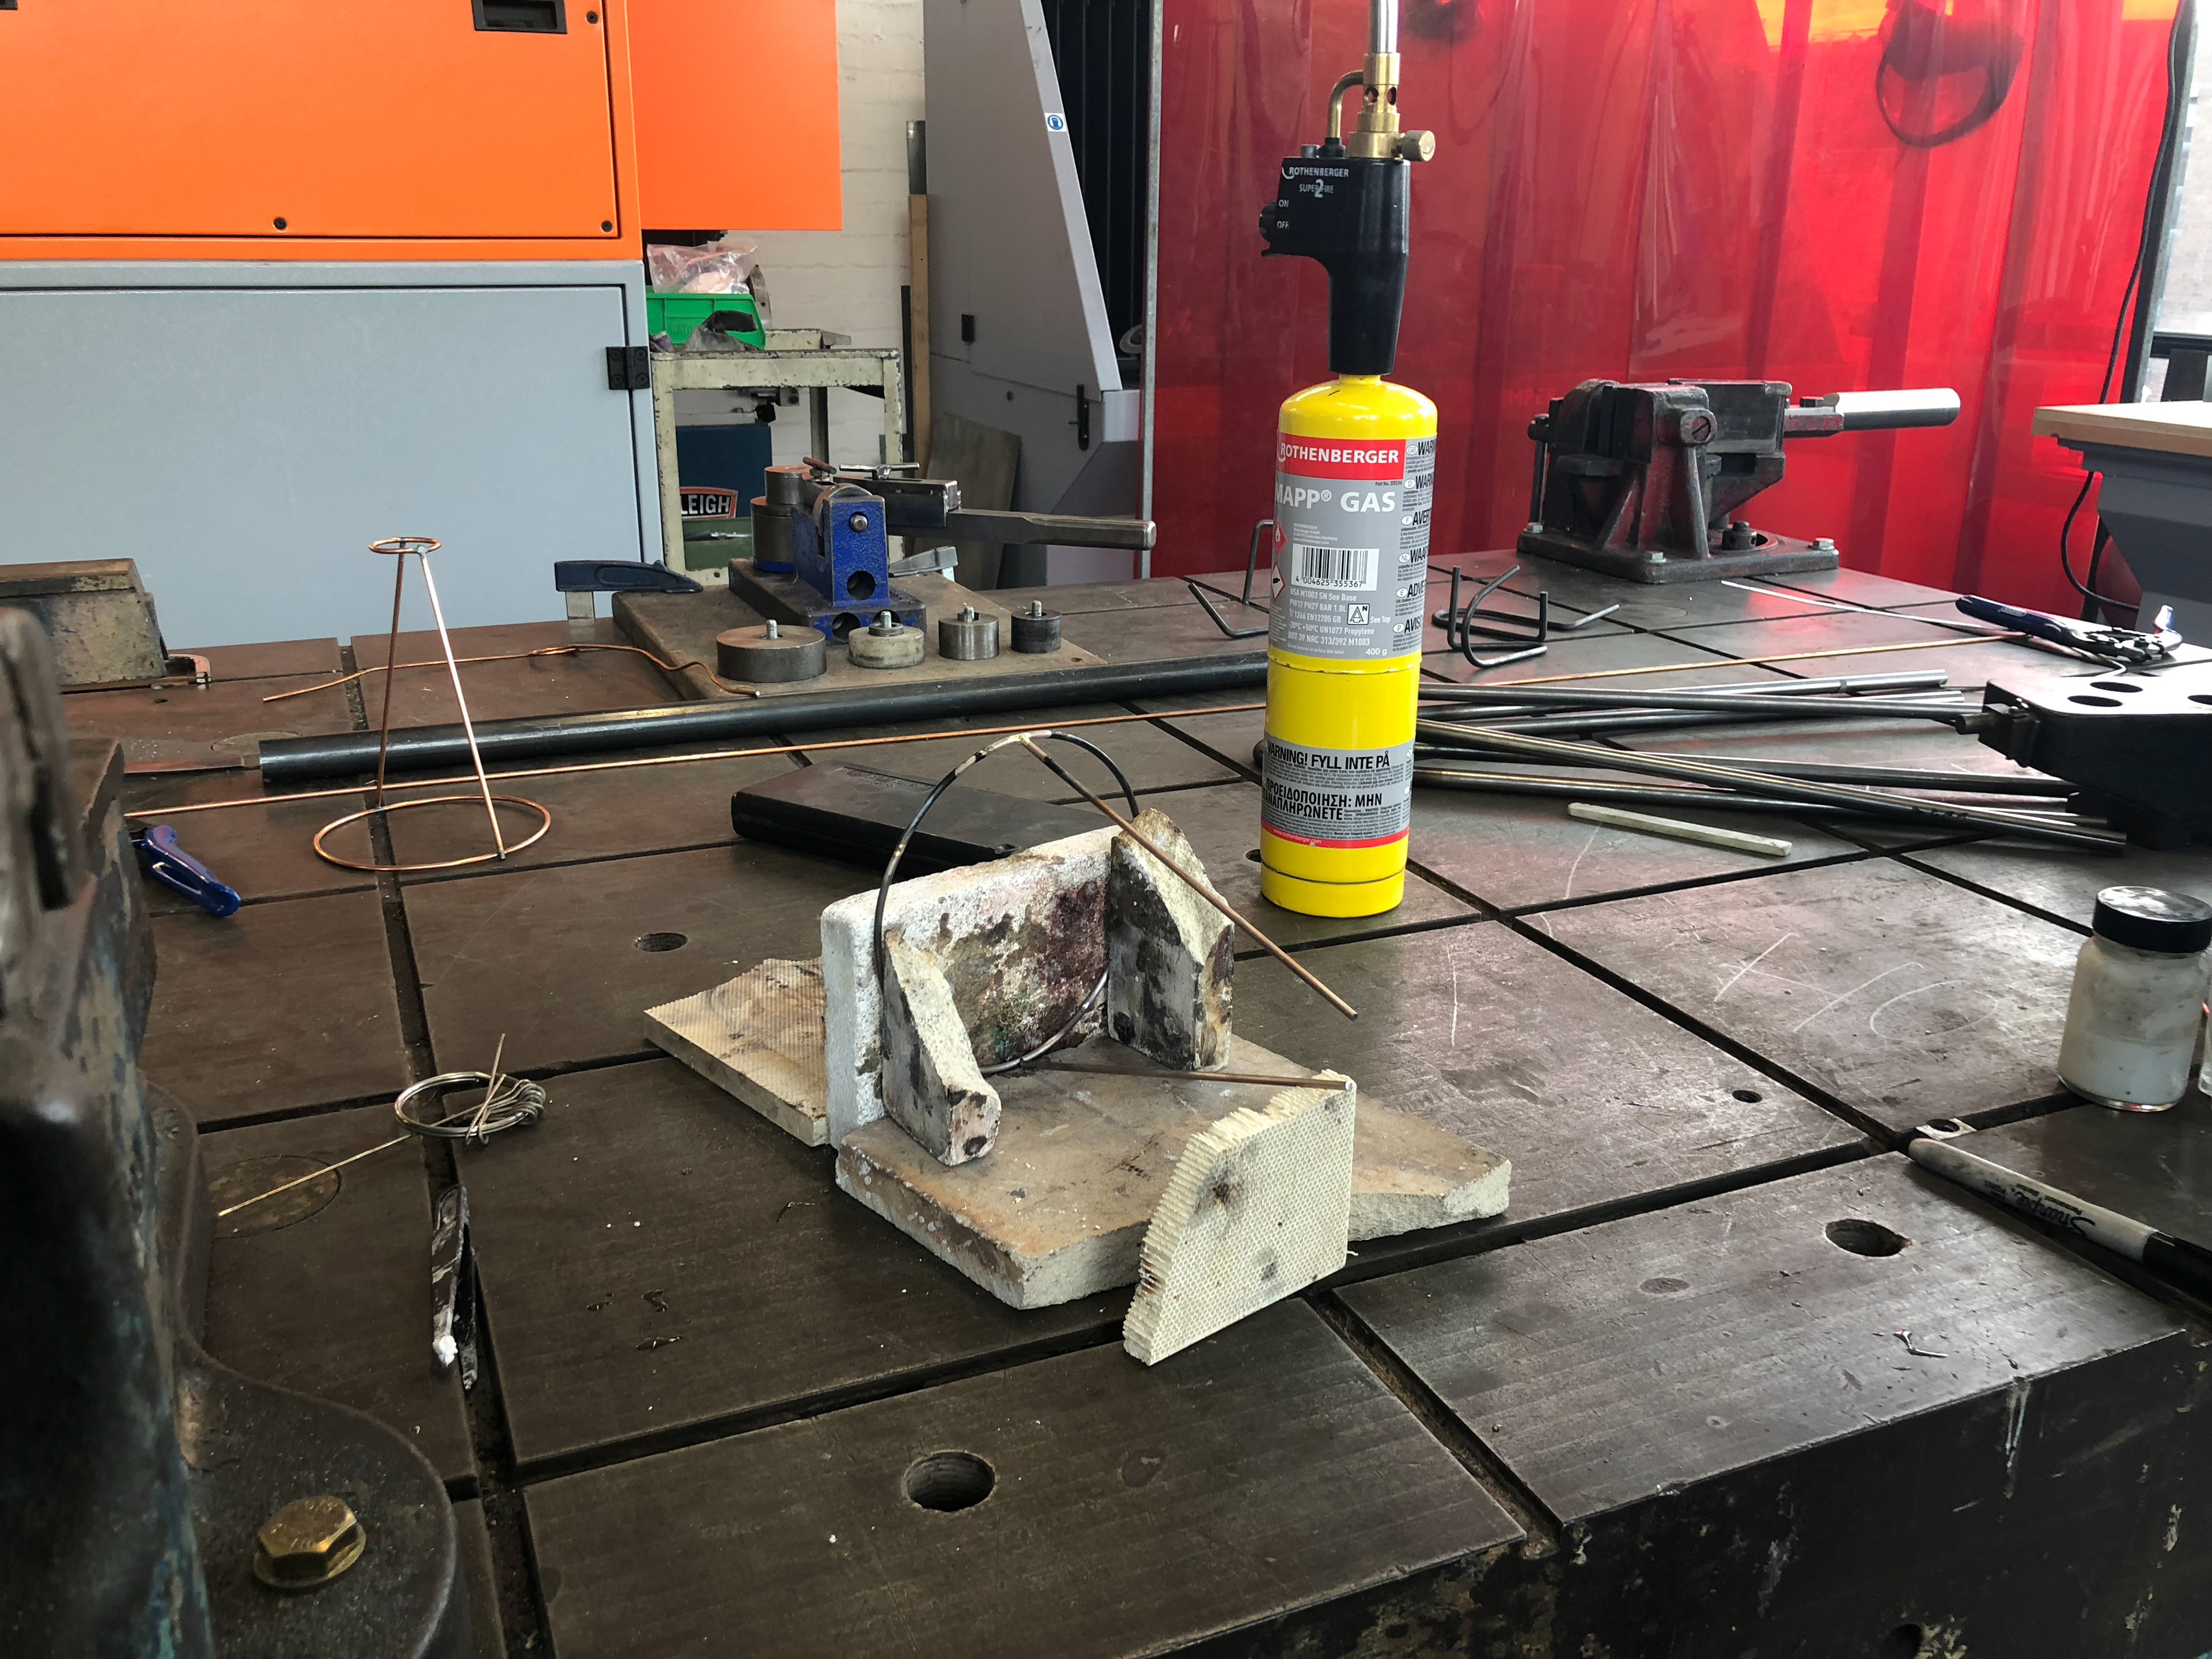
This is an application for information about crude oil and its impact, in 50 years time. The black liquid represents the amount of available crude oil at the moment. The bulb depicts the energy consumption. The shape of structure represents the light beam. And the cotton ball portrays the atmosphere of the Earth.
The way it operates inspired by the function of an hourglass, by using gravity as an indication of time. But this device is irreversible due to the fact that crude oil is a non-renewable resource. Energy consumption from oil has also changed our atmosphere, the gas we’ve already pumped to the atmosphere would last tens of thousands of years. So this is my intention to make the metaphor of how it stays up there almost forever - it doesn’t really disappear.
According to the data, at current use, the current proven reserves project to about 50 years of supply. The trend of the extraction rate and the amount left will continue to plummet and will stabilise at around 2070. So you can notice that in the beginning, the dripping pace was pretty quick as opposed to the ending where it barely dripped. That’s because I mixed oil and water in a certain proportion that would create a synchronisation between visual and data.
Source: http://www.roperld.com/science/minerals/Oil_USGasolinePricesPrediction.htm
https://ourworldindata.org/how-long-before-we-run-out-of-fossil-fuels
